Data Cube provides developers with a solution for full-cycle audio/video quality monitoring, traceback and analysis. With the assistance of quality collection and analysis on all audio/video links, you can find problems and their causes for solving, thus improving the user experience.
It can solve audio freeze, video freeze, no sounds and no videos in audio/video fault scenarios, facilitating the location and analysis of out-of-sync audios and videos.
Visualization is to display full-link quality data of each call in a chart, and extremely improves the efficiency of solving in-call problems.
Data in Data Cube involves:
Audio/video sending/receiving bit rates
Device performance including CPU usage and memory usage
Local capture volume and remote play volume
Audio/video sending/receiving frame rates
Video sending/receiving resolutions
Uplink/downlink P2P packet loss rates of videos
Scores on audio/video freeze
User behavior events, such as network switching, publishing, stopping publishing and receiving freeze
Call search is to search all channel call lists required on the basis of time range, channel ID or user ID.
Fields in each call list include:
Channel ID: the ID of a call channel;
Start time: the first point-in-time when all users join the call;
End time: the time when the last user leaves the channel;
Publishing duration: the duration got by subtracting the start time by the end time.
Click Channel Overview of one call, to jump to the corresponding audio/video quality analysis module.
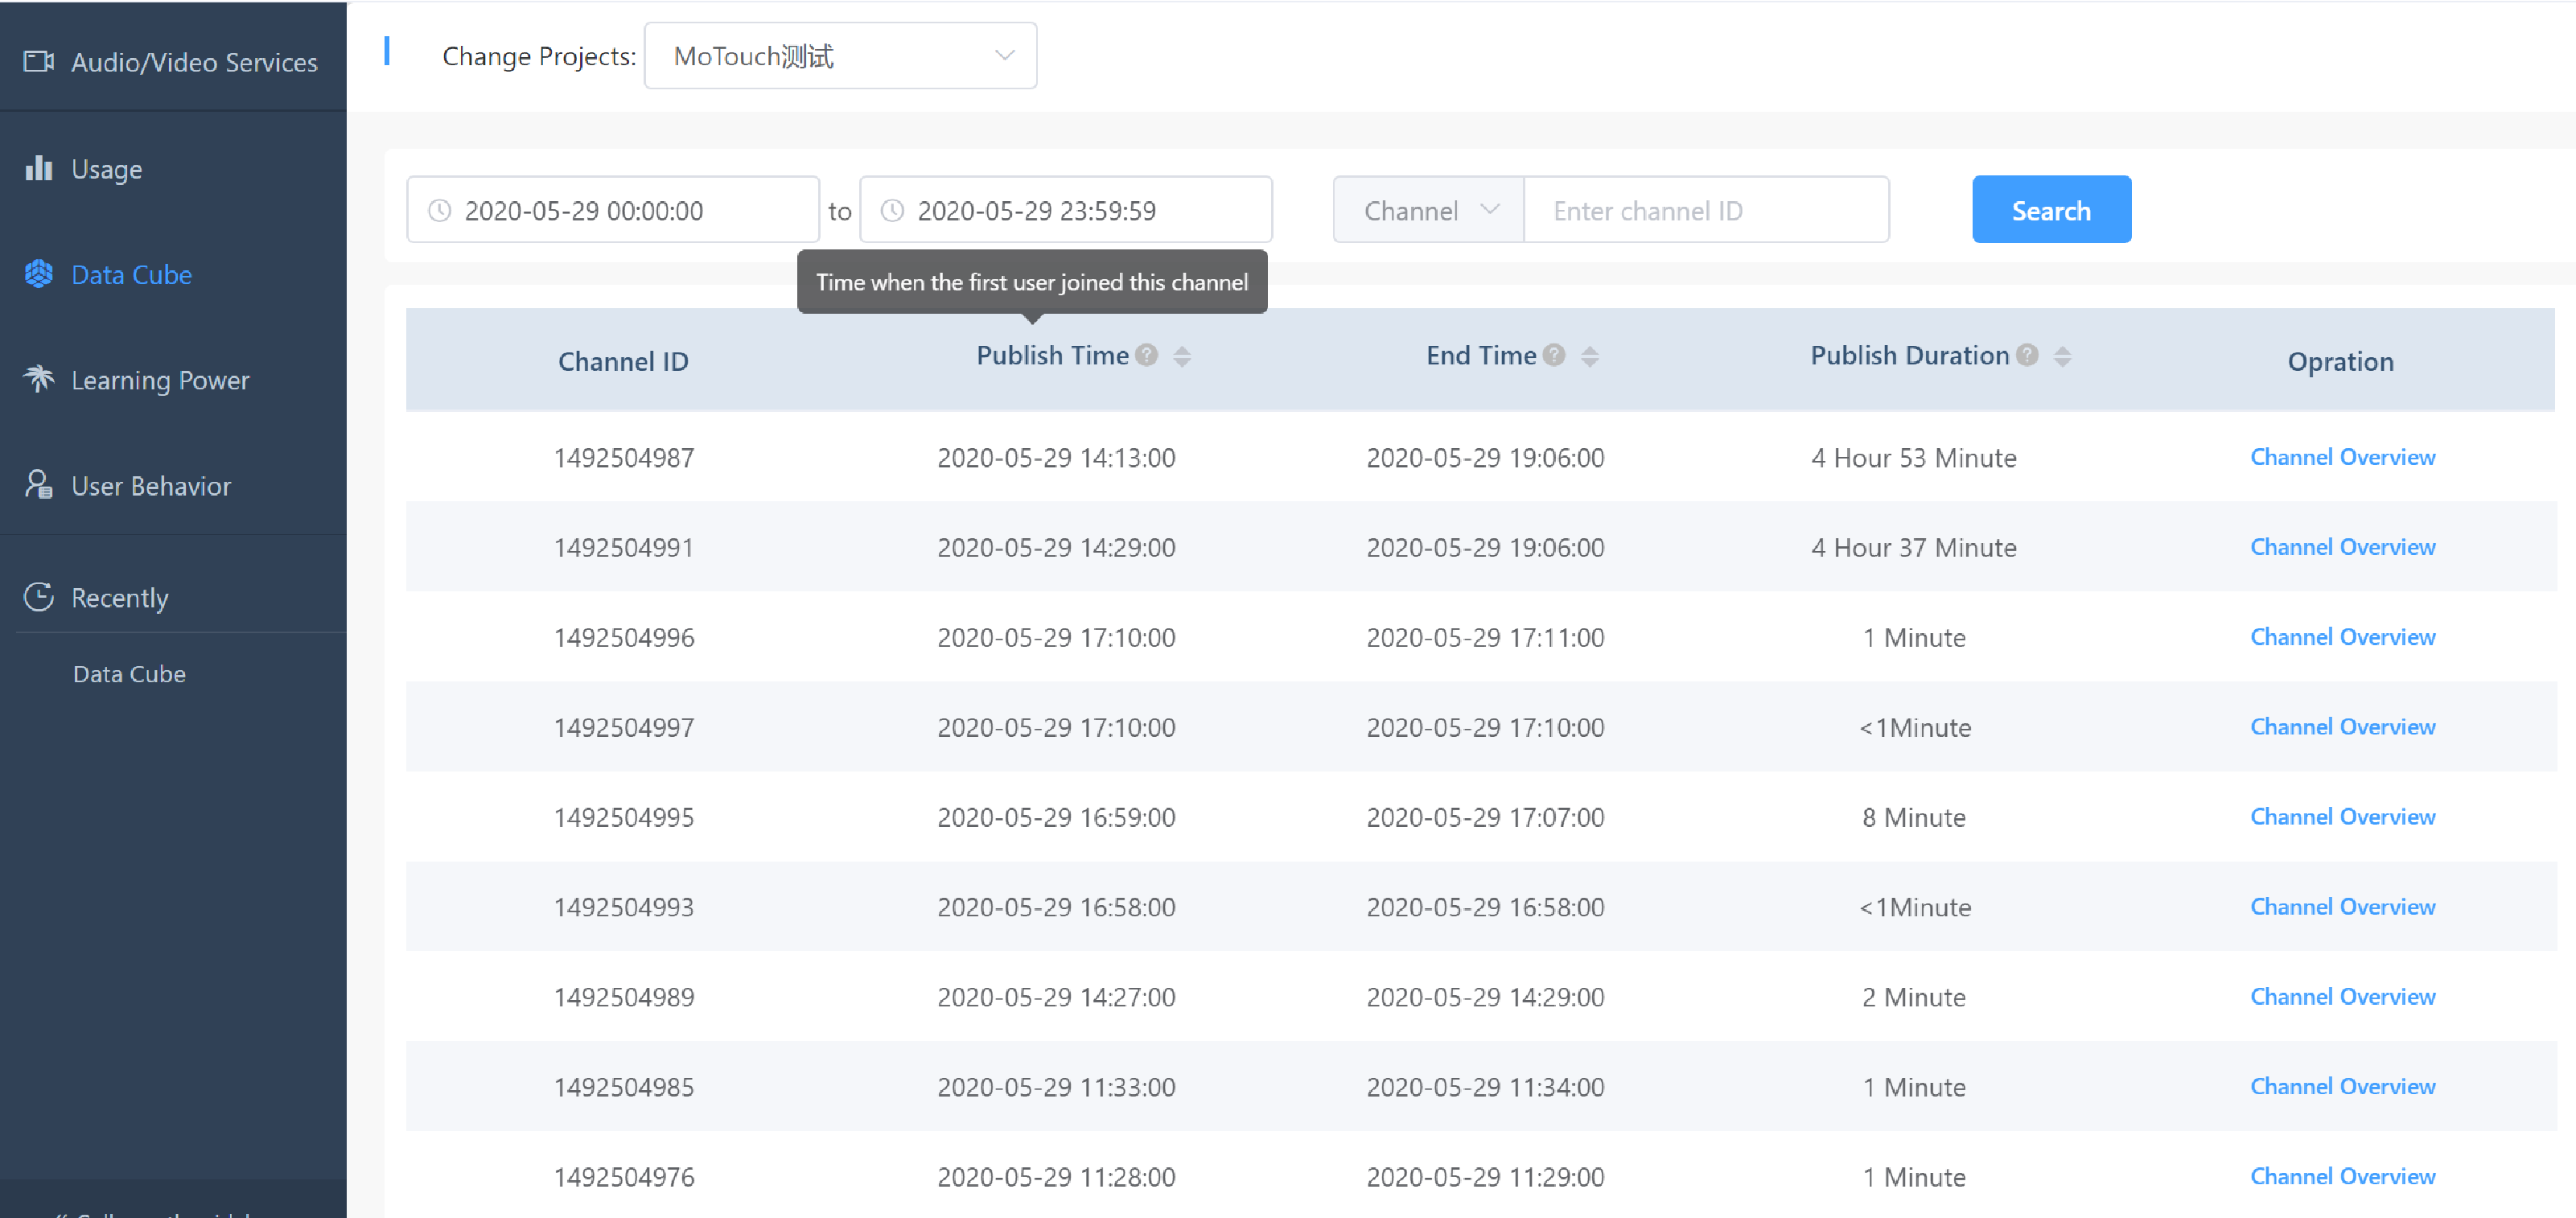 Steps for searching calls:
Click an item to be searched at the left top corner.
Specify a time range for searching the item (a time range in that day by default).
Search according to channel name or user ID.
Click [Search] button to display all calls satisfying search conditions.
The call search only supports searching data of the last 15 days.
The duration in call search is only a reference value, but not the duration for billing.
Channel overview is to display call experiences of users on a publishing end and a viewing end in one channel call, such as whether audio/video freeze, audio/video traffic fluctuation, no sounds and no videos occur during the call, and helps you to know about the experience quality of this call quickly. This page displays basic information of channel calls, a user list and a call experience quality panel from top to bottom.
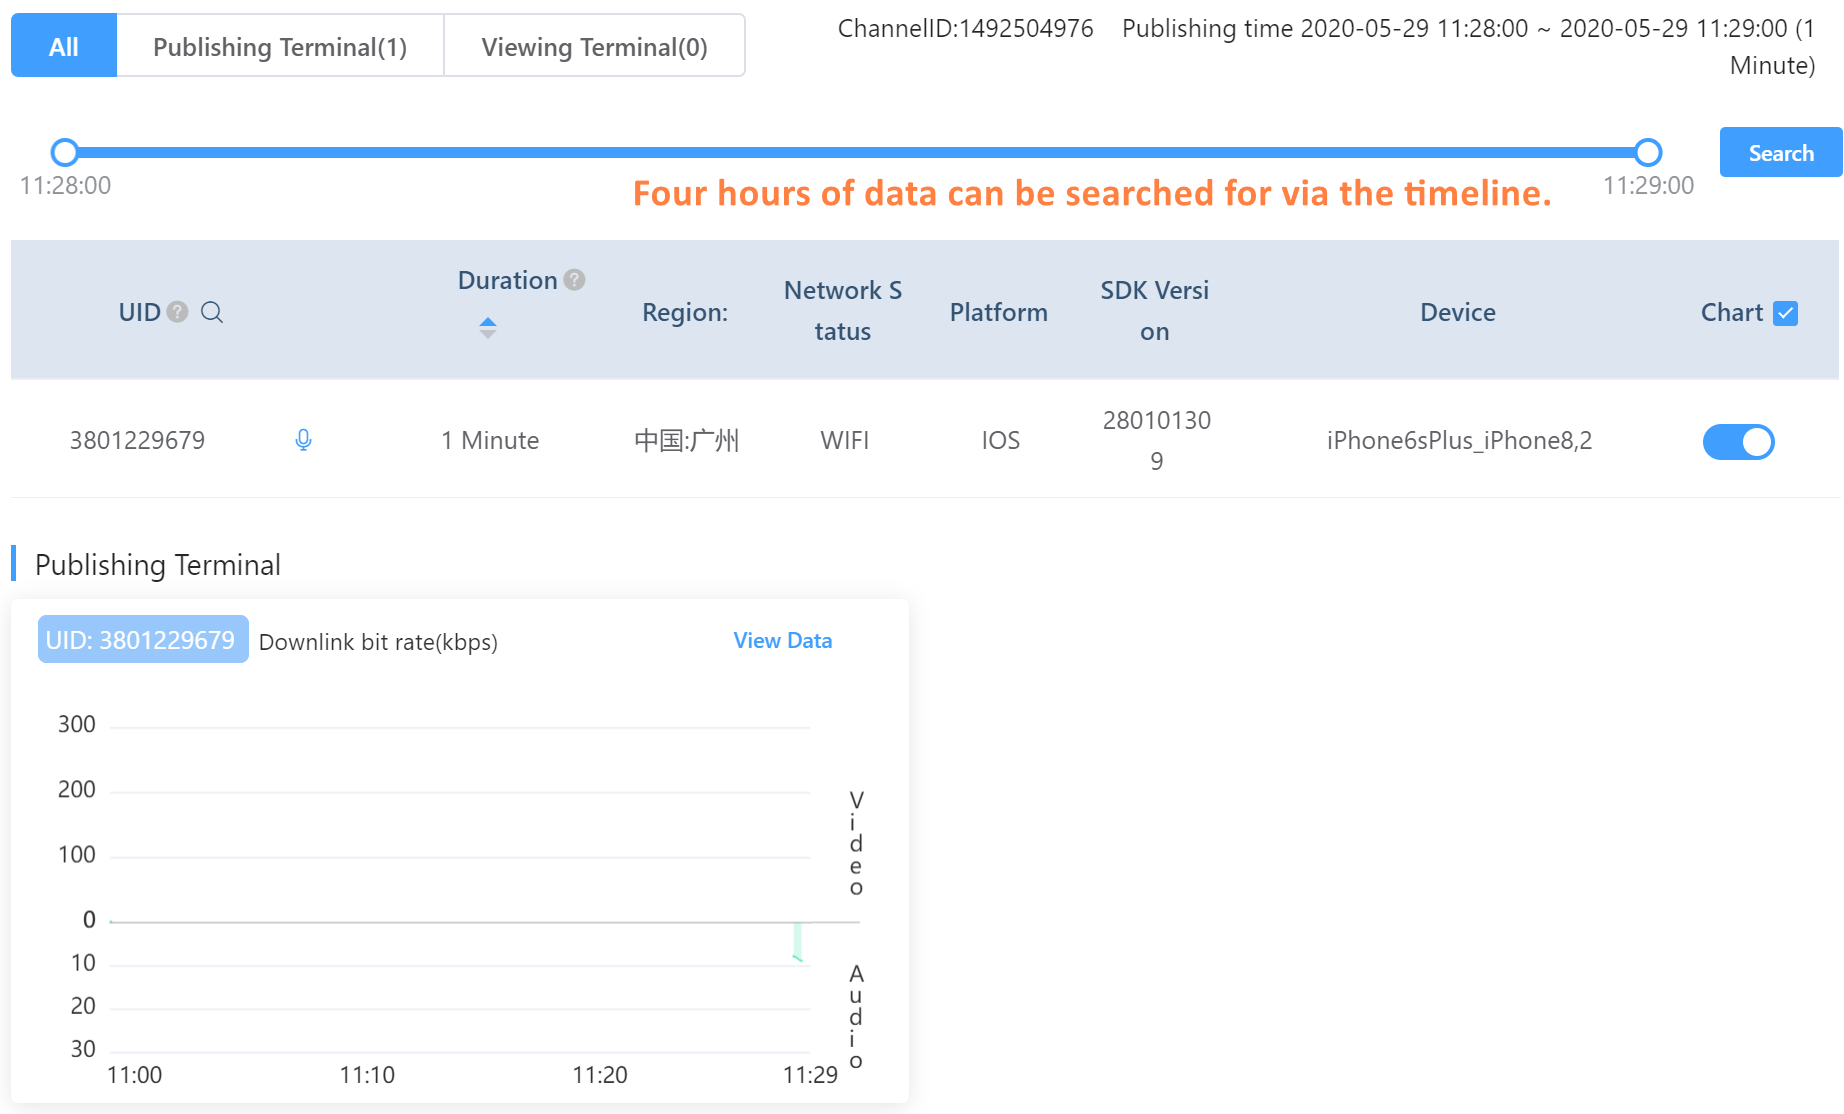
Basic information of calls displays your channel name, and start/end time and total duration of one call.
The button group is used to screen user’s publishing mode (a publishing end or a viewing end). The default is to check all buttons.
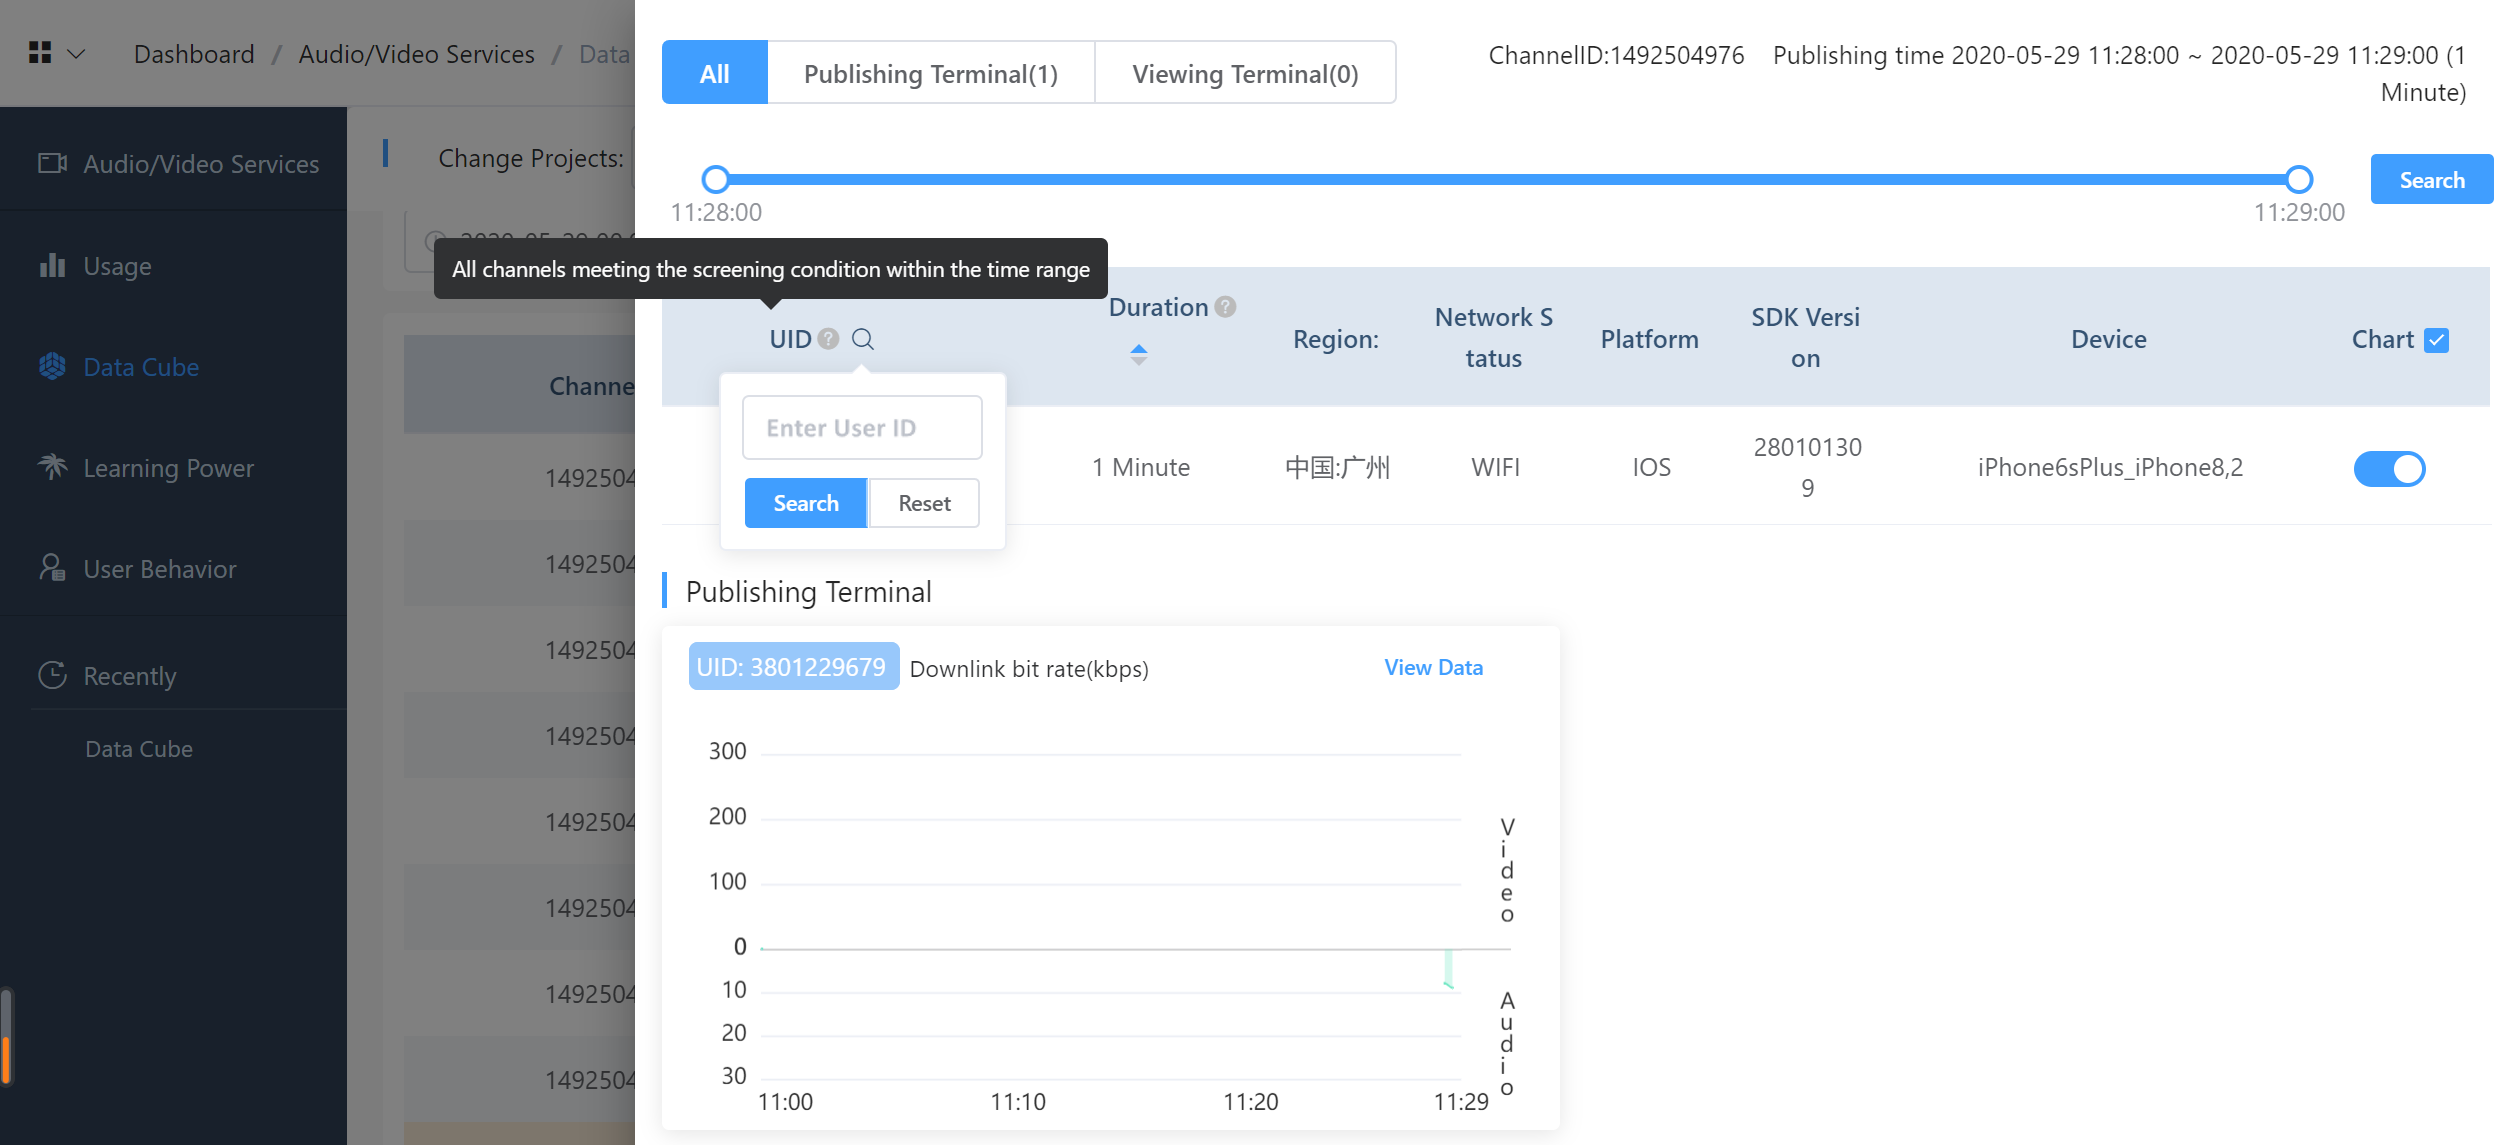
The duration allowed to search calls is 4 hours at maximum, and the last 4 hours are selected by default. When searching other points-of-time, you need to drag the time axis of calls for switching.
The user list displays user IDs, publishing modes, total duration after users join a channel, regions, network statuses, terminal platforms, SDK versions, device information, and other information.
In the last column of the user list, you can select whether to display this user’s call quality in the call quality item below.
This page provides a paging mode for displaying excessive users in the call, and each page displays 5 users. Or click user ID column header for enabling user ID filter to screen corresponding user IDs.
The call quality panel of publishing end displays the call experience quality of each audio/video publisher.
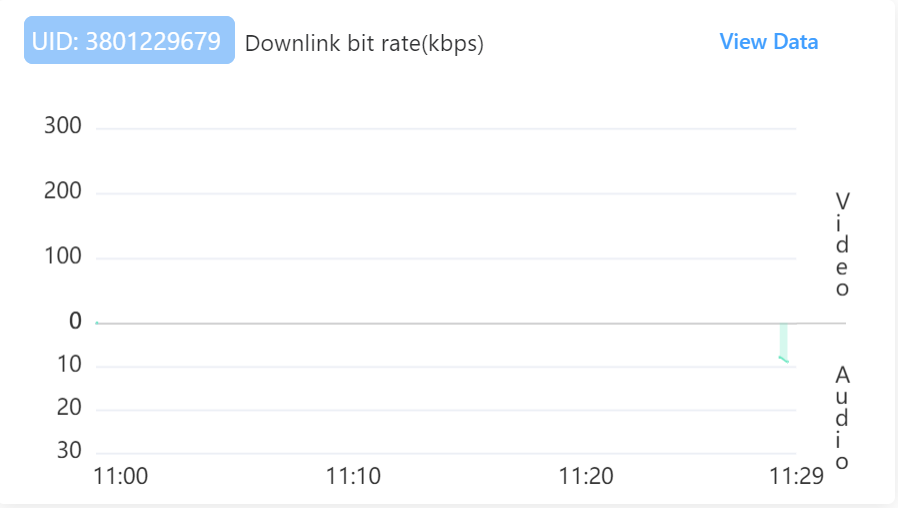
The upper part of panel displays basic information of a user, involving user ID, specification names and units in the chart, and an audience ID list correlated with this user. The audience ID list is allowed to screen. Click one audience ID to jump to the P2P troubleshooting interface of Data Cube.
The lower part of panel displays a trend chart of user's audio/video sending bit rates in kbps. This chart includes a trend chart of video sending bit rates at the top, and a trend chart of audio sending bit rates at the bottom.
The chart is used to determine whether user’s audio/video quality is stable on the basis of the trend chart of sending bit rates. Behavior events of some users are added to the chart and are displayed in a histogram.
The call quality panel of viewing end displays the call experience quality of each audio/video receiver.
The upper part of panel displays basic information of a user, involving user ID, specification names and units in the chart, and publishing end user ID list correlated with this user. The publishing end user ID list is allowed to screen. Click one anchor ID to jump to the end-to-end troubleshooting interface of Data Cube.
The lower part of panel displays a trend chart of user's audio/video receiving bit rates in kbps. This chart includes a trend chart of video receiving bit rates at the top, and a trend chart of audio receiving bit rates at the bottom.
If a user receives multiple publishing end user IDs, there will be multiple lines displayed on the trend chart at the top. Each publishing end is represented by a different line in a different color.
When the mouse cursor is moved to the top of chart, all charts will be linked to display tooltip, facilitating user’s observation on common problems of all users at the same point-in-time.
The upper part of chart displays histograms in different colors, in which green represents normal events, yellow represents general events and red represents serious events. The histograms represent user’s behavior events.
If finding that the quality of call experience with one publishing end is bad, click View Publishing End at the right top corner of panel, and select this publishing user ID to go to the P2P Details page for analyzing specific problems of call quality.
The End-to-End Details page provides detailed audio and video quality indexes from a specific publishing end to a specific viewing end, which commonly determine the call experience of end users.
You can switch a publishing end list at the upper left side to quality analysis for other anchors.
An audience list at the lower left side displays audio/video streams received from anchors above.
You can switch analysis on audio quality and video quality via the above menu in the middle.
The middle part displays call quality of users on the publishing end and the viewing end.
The panel displays a region, an SDK version, a platform, a network type, device information, and other basic information, which are finally reported by the user.
The panel displays a quality trend of user specifications. Different specifications are displayed in different charts, and user behavior events are stacked on the charts.
When clicking Compare button on the viewing end, you can compare data quality of multiple audience users.
Quality summary is to analyze and summarize all quality data in the user period, and conclude seriously impacted audio/video quality, to provide summary of impact factors and cumulative duration of exceptions.
Summarized factors involve:
No audio data: No audio data is enabled on the publishing end.
No sound output: No audio data is sent out from the publishing end, and you should analyze whether an audio frame is generated in accordance with captured audio frame rates.
Network packet loss: The network connection of the publishing end is instable.
Excessive load of device performance: Excessive load of CPU and memory usage of a device on the publishing end will impact the publishing quality.
Disconnection with server: The network connection between the publishing end and the server is instable.
No video data: No video data is enabled on the publishing end.
No video picture output: No video data is sent out from the publishing end, and you should analyze whether a video frame is generated in accordance with captured video frame rates.
Excessive fluctuation of video frame rates: The capture on video frames of the publishing end is instable, resulting in fuzzy and frozen pictures.
Delayed data sending caused by slow network connection: Video data cannot be sent out in case of instable network connection of the publishing end, resulting in frozen pictures on the viewing end.
No videos: The viewing end does not receive video stream data from the publishing end.
No sounds: The viewing end does not receive audio stream data from the publishing end.
Great fluctuation of video frame rates: The video on the viewing end is discontinuous, resulting in freeze, fuzzy videos and other phenomena.
You can analyze audio/video indexes on the P2P Details page, to find out root causes of audio/video quality problems. Each index represents the specific meaning as below:
The bit rate refers to data bits transmitted in unit time during data transmission, and the data unit for panel display is kbps.
The higher the video bit rate, the better the image quality; the higher the audio bit rate, the better the tone quality. The low bit rates may not cause quality problems. However, the audio/video specifications are relatively poor when the bit rates are too low.
The uplink bit rate indicates data output by an encoder of the publishing end; the downlink bit rate indicates data received from the viewing end.
Packet loss refers to data packet loss during data transmission, and the data unit for panel display is %.
The network packet loss of publishing end refers to packet loss in a data sending process, and the P2P packet loss of viewing end refers to packet loss from the publishing end to the viewing end.
In general, slight packet loss has no impacts on audio/video call experiences. Higher packet loss rate (exceeding 5%) indicates that the network quality is relatively poor, and audio/video freeze, fuzzy video and other problems may be caused.
The frame rate refers to a rate at which bitmap images of a frame appear on the display continuously, and the data unit for panel display is fps.
Usually, the video frame rate is 24 or 15 frames. The higher the frame rate, the more fluent the video, while higher network bandwidth and better CPU performance are also required. Visual freeze may be caused when the frame rate is too low.
Usually, the frame rate of audios is constant at 50 or 20 frames. Excessive fluctuation of the frame rate may cause instable sounds and freeze during answering.
The device captured volume refers to an audio value captured by the audio device of publishing end.
The volume represents a sound level of a publishing end user. The audience cannot hear sounds when the volume is too low.
The device performance represents the stability of device performance in accordance with CPU usage and memory usage of a device, and the data unit for panel display is %.
Determine the video output and playing stability of the device in accordance with the device performance. Video freeze will be caused due to higher performance configurations of the device, and videos cannot be output or played.
The resolution refers to a pixel value (width x height) of an image.
The higher the resolution of sent/received video pictures (the higher the pixel value), the clearer the video pictures.
The user behavior events are reflected on the time axis of a quality chart for channel calls. The events are displayed in histograms in green, yellow and red, in which green represents normal events, yellow represents general events and red represents serious events.
The normal events have no impacts on audio/video call experience, for example, a user joins a channel, turns on a loudspeaker and plugs in a headset.
The general events have certain impacts on channel calls, for example, a user stops sending/receiving audio/video streams, the IP address changes, etc.
The serious events certainly have impacts on the call experience, for example, the publishing end stops audio/video sending and network switching, freeze is caused while audios/videos of a certain user are viewed on the viewing end, sounds from certain user ID cannot be heard, network switching is enabled, etc.
User events involve:
Network switching: For example, a user switches the network from 4G to WiFi, and from 4G to 2G, etc. (serious event)
Audio status of a publishing end: enabled, describing that the user has just turned on an audio device for starting audio publishing (normal event).
Audio status of a publishing end: disabled, describing that the user stops audio publishing, that is, the user ends the audio play (serious event).
Audio status of a publishing end: reset, describing that the user starts audio publishing again (general event).
Reconnection with a server, describing that the user reconnects to a media server to determine whether the network connection between the user and the server is exceptional (serious event).
Capture status of an audio device: enabled, describing that the audio device of publishing end is enabled (normal event).
Capture status of an audio device: disabled, describing that the audio device of publishing end is disabled (serious event).
No sound output from an audio device, describing that the audio device should be inspected when the audio output of publishing end is exceptional, and no audio frames are generated (serious event).
Too long time for disconnection with a server (duration: Nms), describing that the publishing end disconnects from the server for N milliseconds, and network faults should be located (serious event).
Bluetooth audio device: enabled, describing that the user enables the Bluetooth audio device (normal event).
Bluetooth audio device: disabled, describing that the user disables the Bluetooth audio device (serious event).
Disconnection with signaling server, describing whether the network connection between the user and the signaling server is normal (serious event).
Audios from users [anchor ID]: serious freeze, describing that freeze occurs when the audience receives audio streams from the anchor ID, resulting in no sounds heard or sound freeze (serious event).
Videos from users [anchor ID]: serious freeze, describing that freeze occurs when the audience receives video streams from the anchor ID, resulting in no videos viewed or video freeze (serious event).
 Helpful
 Not helpful
 Submitted! Your feedback would help us improve the website.
 Feedback
 Top
Top